
As I add more data to the NYC Chaos Dashboard, a website that maps live urban activity, I have been looking for a more efficient way to render the map.
Since I collect all of the data in one process and return the Dashboard as one HTML file, I kept wondering how I could
optimize the map’s loading time by pre-processing the data as much as possible in the backend. This is where vector tiles come in.
The code shown in this post is written in Go.
Why generate tiles?
Initially, all of the map’s data was passed to the rendering library in GeoJSON format (embedded directly in the HTML file). For those who don’t know, GeoJSON is a JSON based standard to represent geographic information. You can go see the full RFC here, but here’s a quick preview of what it looks like so you can get an idea:
{
  "type": "Feature",
  "geometry": {
    "type": "Point",
    "coordinates": [-74.04452395542852, 40.68987850656795]
  },
  "properties": {
    "name": "Statue of Liberty",
    "status": "open"
  }
}
Now, I’m definitely not JSON’s greatest fan. It’s all text, meaning that a number is stored in a base 10 ASCII representation, where a number like 42 gets stored as "4" and "2".
I could go on, but I think you see the problem: it’s not the most efficient way to store data. Nonetheless, JSON has a lot of merits: it’s human-readable and easy to share between systems, so I find myself using it more
than I’d like to - more often than not, simplicity is the way to go, and a simple format like GeoJSON just gets the job done, and that alone makes it a worthy geographic standard.
So what happens when I start adding more layers to the map? It gets slow. I’m working on adding flood sensor data (thank you Floodnet for granting me access to the API), LIRR and MetroNorth data, NYISO power data,
and many more datasets which will start adding a lot of layers to the map. I can already see that the HTML file, at the time of writing, is 4.5Mb (once decompressed) and takes ~770ms to transfer from Cloudflare’s CDN to my browser.
This seems pretty reasonable for now, but it won’t scale as the future datasets are much larger, and running a quick check on the website, chrome is already telling me that the site has performance issues:
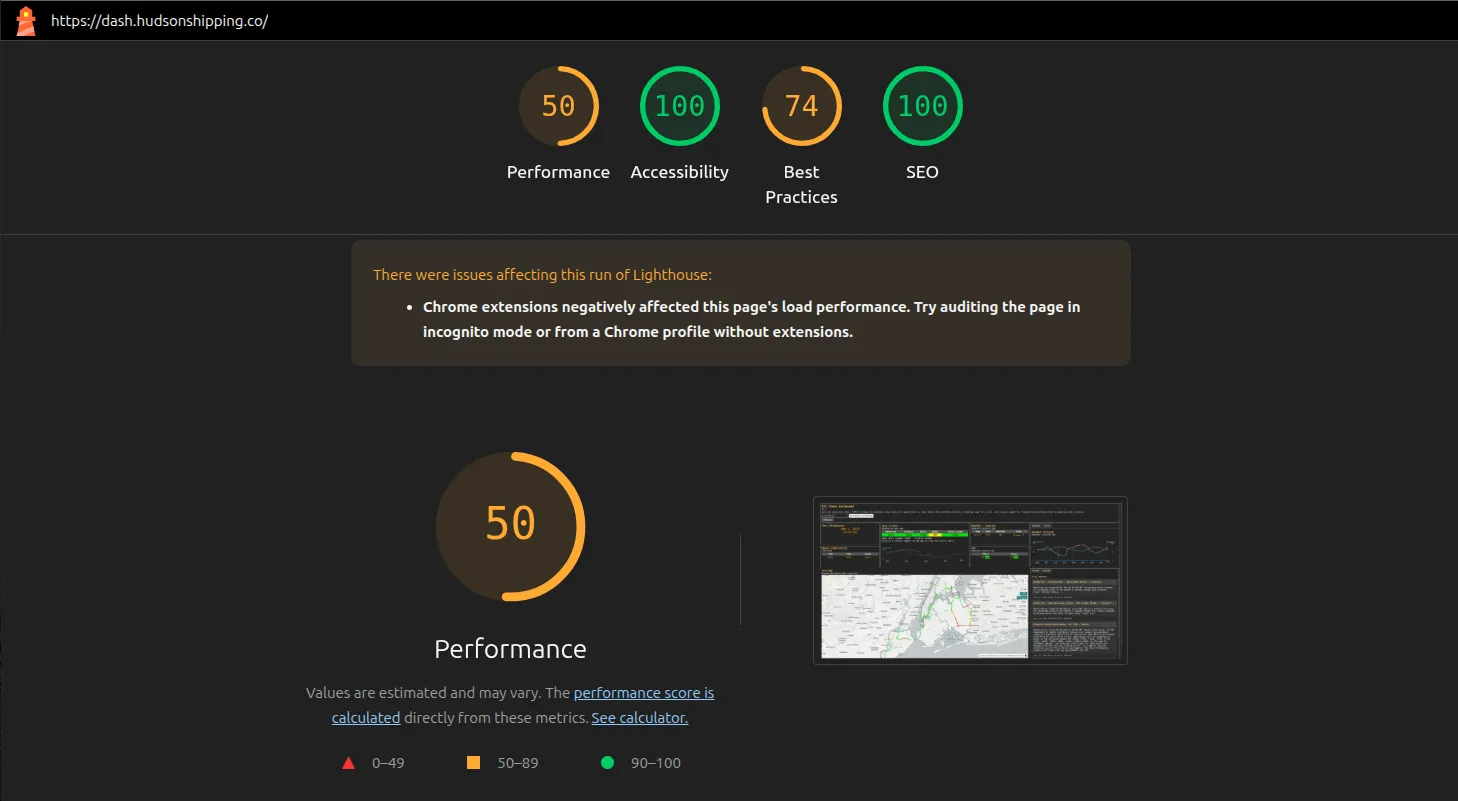
And if I look more closely, I can see that it’s the result of a long rendering (over 2s!), which I can see here:
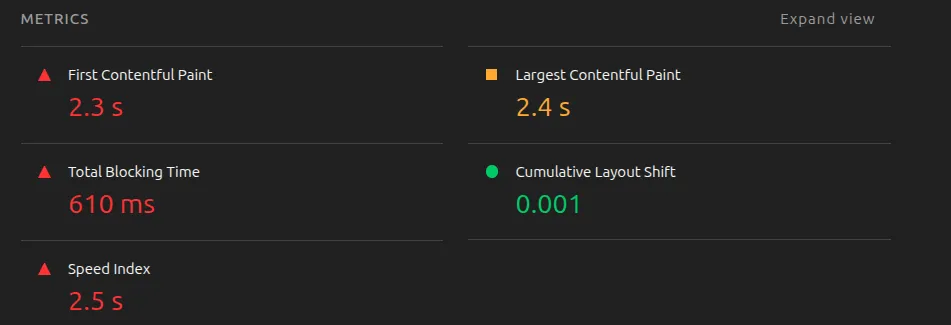
Now, I suspect this is the result of a few things:
- As mentioned above, all of the embedded data is GeoJSON. This means the rendering library (MapLibre GL JS) needs to parse the JSON. There’s a lot, with a lot of properties, so this takes time.
- MapLibre GL needs to then take the coordinates and then place the lines, points and polygons on the map accordingly. This takes time, and it all happens on your browser.
I don’t like this - I want a map that people can use to check on the status of their city, and not a bloated HTML page that gets slower as more data gets onboarded, ironically making it less and less usable.
So, how can I display many large datasets on a map?
An obvious, and honestly wise, solution would be to simply load the GeoJSONs separately, via a GET request. You can do this simply in MapLibre:
map.addSource('resurfacing', {
    type: 'geojson',
    data: 'https://dash.hudsonshipping.co/data/resurfacing.geojson'
});
This is so much better than my current solution:
map.addSource('resurfacing', {
    type: 'geojson',
    data: {{.Geo.Resurfacing}}
});
{{.Geo.Resurfacing}} is the code in my HTML template that gets rendered in my Go process.
Loading GeoJSONs via a GET request will result in a lighter HTML file and a faster rendering of the Dashboard (the non-map components at least), but MapLibre still needs to parse that JSON and figure out how and where to plot the geometries. This is still not optimal. So how do big companies handle this? To display large amounts of data on map at scale and with performance, they use Vector Tiles, loading geometries sector by sector.
What are Vector Tiles?
Vector Tiles are small files that also represent geographic features, similar to GeoJSON. The key difference is that they represent a specific sector, a tile (thus the name), at a specific zoom. That means if I want to display a map of the world with Vector Tiles, it will actually be a collection of square tiles pieced together. Imagine taking a globe and cutting it up in multiple squares - that’s what vector tiles are (we’ll ignore distortion and projections for now, that’ll be a post for another time).
You may already be familiar with them when interacting with online maps, like Google Maps, where you can notice your features contained in squares, with some squares loaded before others:
MapTiler made a great demonstration of Tiles, showing the tile coordinates at different zoom levels.
 Unlike GeoJSON where all features (point, line or polygon) of a layer are stored in one file, Vector Tiles (MVT) store features in smaller files that represent a specific area (at a specific zoom, or resolution).
In the above image, the points from the GeoJSON file are split into 3 tiles (tile 4 being empty).
Unlike GeoJSON where all features (point, line or polygon) of a layer are stored in one file, Vector Tiles (MVT) store features in smaller files that represent a specific area (at a specific zoom, or resolution).
In the above image, the points from the GeoJSON file are split into 3 tiles (tile 4 being empty).
So this is just a raster, then?
No, and this is where vector tiles get even more interesting. Like rasters, they represent data in a specific part of the world. But unlike rasters, vector tiles don’t store an image, they store instructions. This is very, very similar (you’ll see just how much in the next section) to a JPEG vs an SVG. This means vector tiles contain commands to draw layers and features that can then be customized in the rendering library:
- Have a road you want to display as congested? Just set the line-color to red
- Have a live event you want to display? Go for it, just add some custom animation to make the point pulsate
 AS you can see in the above illustration, an Vector Tile file contains commands on how to plot the data using a local coordinate system, and not just a grid of pixels.
Ok, so how do I create one of these tiles and load it on a map?
Ok, this is the fun part - and it’s a lot easier than I first thought it would be. We’ll use the current standard for vector tiles, which you may have glimpsed in the previous sections: Mapbox Vector Tiles (MVT). MapLibre can handle this natively, and the documentation seems pretty easy:
map.addSource('some id', {
    type: 'vector',
    tiles: ['https://dash.hudsonshipping.co/{z}/{x}/{y}/tile.mvt'],
    minzoom: 6,
    maxzoom: 14
});
So I need to have an endpoint that serves up MVT files for a given tile (x,y) at a given zoom z. That part isn’t too hard, it’s a simple HTTP endpoint. So now, I need to actually be able to generate the MVT file.
Mapbox has done a great job documenting the spec, you can find it here. I used this as the main reference for the project, as it contains everything you need to construct a vector tile. For all transformations, I simply used the code made available my MapTiler.
An MVT represents information in binary format - this means it’s not human-readable, unlike GeoJSON. To generate the binary output,
Mapbox has opted for Protobuf. If you don’t know Protobuf, it’s Google’s standard to normalize structured data in a binary format with predefined fields and datatypes described in a .proto file. If you want to learn more about the project, I recommend checking this out. This is what the MVT proto file looks like:
message Tile {
        enum GeomType {
             UNKNOWN = 0;
             POINT = 1;
             LINESTRING = 2;
             POLYGON = 3;
        }

        message Value {
                optional string string_value = 1;
                optional float float_value = 2;
                optional double double_value = 3;
                optional int64 int_value = 4;
                optional uint64 uint_value = 5;
                optional sint64 sint_value = 6;
                optional bool bool_value = 7;

                extensions 8 to max;
        }
        message Feature {
                optional uint64 id = 1 [ default = 0 ];
                repeated uint32 tags = 2 [ packed = true ];
                optional GeomType type = 3 [ default = UNKNOWN ];
                repeated uint32 geometry = 4 [ packed = true ];
        }

        message Layer {
                required uint32 version = 15 [ default = 1 ];
                required string name = 1;
                repeated Feature features = 2;
                repeated string keys = 3;
                repeated Value values = 4;
                optional uint32 extent = 5 [ default = 4096 ];

                extensions 16 to max;
        }

        repeated Layer layers = 3;
        extensions 16 to 8191;
}
Ok, so looking at the proto, we can see that a tile is essentially an array of layers, each layer being able to contain multiple features. To make this more understandable, here’s an example of what you could put in a tile:
-
Layer 1: Monuments
- Feature 1: Statue of Liberty (type: Point)
- Feature 2: Eiffel Tower (type: Point)
-
Layer 2: Airports
- Feature 1: JFK (type: Point)
- Feature 2: CDG (type: Point)
We’ll use this example throughout this section to construct a tile, and specifically focus on the Statue of Liberty. We can see that a layer represents a dataset you want to display on a map, and a feature is a datapoint in that dataset. A tile can contain multiple layers, and thus multiple datasets. At a certain resolution, we expect the Statue of Liberty to be in the same tile as the JFK airport, same for the Eiffel Tower and CDG, meaning they’ll be in the same MVT file.
Ok, so now we understand what’s contained in a tile. But how do you actually construct it? Here are the steps required:
- For a given zoom level, identify what tile (x, y) a feature belongs to
- Create the tile and add the geometry
- Add properties via tags
- Return the tile via HTTP
1. Identifying the tiles
Let’s restate the problem we’re trying to solve: we have a GeoJSON file that we want to convert into multiple MVT tiles for performance reasons. As stated earlier, to use MVT tiles in MapLibre we need to be able to return a response for:
https://dash.hudsonshipping.co/{z}/{x}/{y}/tile.mvtSo, this means I need to have multiple tiles generated in the backend, and return the correct one. But how do I know what tile each feature belongs to?
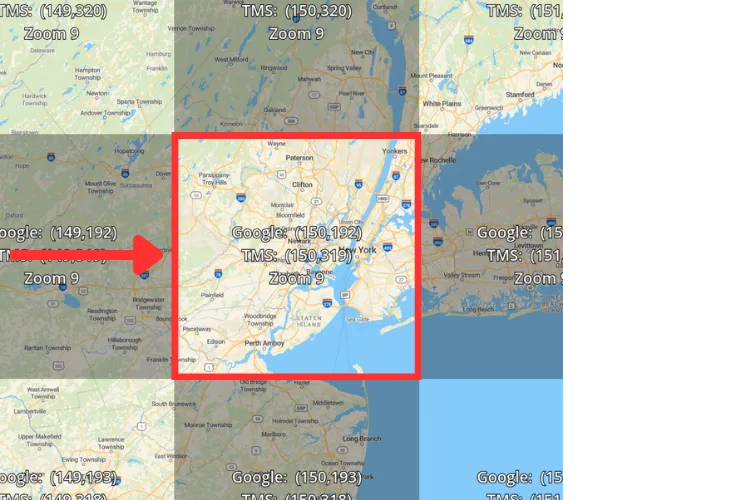
For example, when I am currently at zoom level 9, I can see that the the Statue of Liberty will be in the tile x = 150, y = 192:
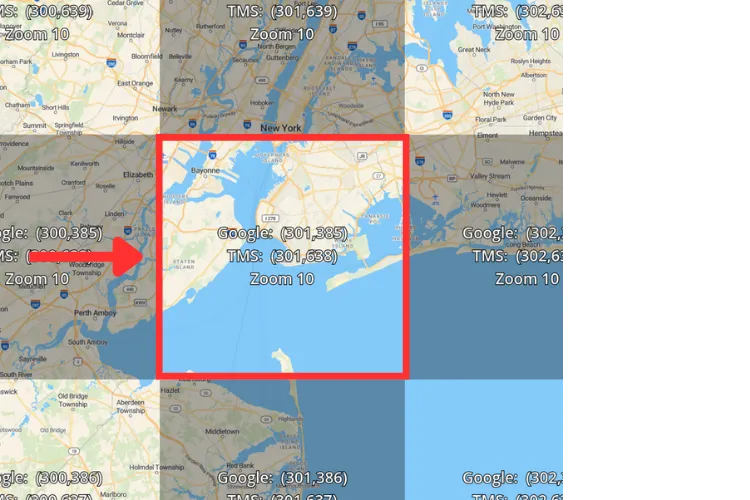
 And if I zoom to level 10, I can see that the Statue of Liberty will be in the tile
x = 301, y = 385:
To properly identify the tile, we need to do a few conversions. At this point, all of my geographic data is normalized to use EPSG:4326, a format most people are familiar with to represent coordinates. For example, the Statue of Liberty’s coordinates in EPSG:4326, expressed in degrees, are:
longitude:-74.04452395542852, latitude: 40.68987850656795.
For vector tiles, the coordinate system used is called Web Mercator (EPSG:3857). In this system, expressed in meters, the Statue is Liberty is located at:
x = -8242598.70274865, y = 4966705.869136138
So we need to convert the Statue of Liberty’s coordinates from degrees to meters, and then identify which square it belongs to at a specific zoom level. This is pretty straight forward, so let’s get right to it.
Let’s finally get our hands dirty and write some code (please add proper error handling, this code is only for demonstration purposes).
First off, I want to convert my coordinates from EPSG:4326 (lon/lat) to EPSG:3857 (meters):
// We will use these constants throughout
const (
	EarthRadius = 6378137 // meters
	TileSize    = 512 // pixels
	OriginShift = 2 * math.Pi * EarthRadius / 2.0
)

func LonLatToMeters(lon float64, lat float64) (x float64, y float64) {
	mx := lon * OriginShift / 180.0
	my := math.Log(math.Tan((90 + lat) * math.Pi / 360.0)) / (math.Pi / 180.0)
	my = my * OriginShift / 180.0
	return mx, my
}
The spec refers to 4096 tile sizes, but MapLibre seems to use 512 pixels, so we’ll stick with this. Once we’ve successfully written the function to convert our coordinates, we can now write the code to get the appropriate tile:
func Resolution(zoom int) float64 {
	// Returns meters / pixel
	initialResolution := 2 * math.Pi * EarthRadius / TileSize
	return initialResolution / (math.Pow(2, float64(zoom)))
}

func MetersToTile(mx float64, my float64, zoom int) (x int, y int) {
	res := Resolution(zoom) // meters / pixel
	px := (mx + OriginShift) / res
	py := (my + OriginShift) / res

	tx := int(math.Ceil(px / float64(TileSize)) - 1)
	ty := int(math.Ceil(py / float64(TileSize)) - 1)
	return tx, ty
}

func GoogleTile(tx int, ty int, zoom int) (x int, y int) {
	ty = int(math.Pow(2, float64(zoom))-1) - ty
	return tx, ty
}
Once we have these utility functions, determining the appropriate tile only requires a few lines of code:
mx, my   := LonLatToMeters(lon, lat)
tx, ty   := MetersToTile(mx, my, zoom)
gtx, gty := GoogleTile(tx, ty, zoom)
We use GoogleTile() because it seems MapLibre uses this standard (simply shift the origin to the top left). I couldn’t find documentation on it,
but I was able to see this behavior during my tests. I’ll update this part if I find the relevant documentation.
Here is what we now have:
mxandmyare the point’s coordinates in meters, using the Web Mercator projection.txandtyare the tile coordinates inTMSformat.gtxandgtyare the tile coordinates in Google format (also known as the XYZ format).
Great, we know what tile our feature belongs to for a given zoom. Let’s go create the tile.
2. Create the tile and add the geometry
Now that we know which tile a feature belongs to, let’s create the MVT file. You’ll need to install protoc for Go:
go install google.golang.org/protobuf/cmd/protoc-gen-go@latestGo ahead and get the official .proto here: https://github.com/mapbox/vector-tile-spec/blob/master/2.1/vector_tile.proto
Generate the struct:
protoc --go_out=./path/to/dir/mvt ./path/to/dir/mvt/vector_tile.protoThis will generate a vector_tile.pb.go that will look something like this:
// Code generated by protoc-gen-go. DO NOT EDIT.
// versions:
// 	protoc-gen-go v1.36.8
// 	protoc        v3.21.12
// source: internal/geo/mvt/vector_tile.proto

package mvt // Make sure to use the correct package here

import (
	protoreflect "google.golang.org/protobuf/reflect/protoreflect"
	protoimpl "google.golang.org/protobuf/runtime/protoimpl"
	reflect "reflect"
	sync "sync"
	unsafe "unsafe"
)

const (
	// Verify that this generated code is sufficiently up-to-date.
	_ = protoimpl.EnforceVersion(20 - protoimpl.MinVersion)
	// Verify that runtime/protoimpl is sufficiently up-to-date.
	_ = protoimpl.EnforceVersion(protoimpl.MaxVersion - 20)
)

// GeomType is described in section 4.3.4 of the specification
type Tile_GeomType int32

const (
	Tile_UNKNOWN    Tile_GeomType = 0
	Tile_POINT      Tile_GeomType = 1
	Tile_LINESTRING Tile_GeomType = 2
	Tile_POLYGON    Tile_GeomType = 3
)
// ...
Once we have generated the protobuf class, we can create an empty tile like this:
func NewTile(layerName string) *Tile {
    // The Tile struct comes from the generated protobuf
	version := uint32(0)
	extent := uint32(TileSize)
	layers := []*Tile_Layer{
	    {
	        Name:     &layerName,
	        Version:  &version,
	        Features: make([]*Tile_Feature, 0),
	        Extent:   &extent,
	    },
	}
	return &Tile{Layers: layers}
}
t = NewTile("monuments")
Great, we now have an empty tile. Let’s add our monument to ut, as a feature in the first layer called monuments.
A feature is defined by a few things:
- A geometry type, in our case a Point
- Tags (properties for that feature, which we’ll add in the next section)
- A geometry
As mentioned earlier, a vector tile behaves similarly to an SVG file: you specify instructions to move a cursor. And that’s
exactly what goes into the geometry field: a series of instructions for a cursor.
Since our monument is a Point, we only have one instruction: move to location (x, y):

As you can see in the above example, we’re telling the cursor to move from the Origin to a specific part of the tile. In this case, we’re letting MapLibre GL know to move the cursor 200 pixels to the right (x axis) and 75 pixels down (y axis).
But how do we get these instructions? Instructions are relative to the Origin of the tile, which is located at the top-left corner.
Coordinates go from 0 to 512 (the Extent of the tile, which we defined above).:

This means we need a few things:
- Get the Web Mercator coordinates of the tile’s Origin
- Calculate the offset,
dxanddyfor a given Point - Convert the offset in meters to an offset in pixels
Getting the tile’s origin is pretty straight forward:
func GetTileOrigin(tx int, ty int, zoom int) (minx int64, maxy int64) {
	res := Resolution(zoom)
	minX := int64(float64(tx) * TileSize * res - OriginShift)
	maxY := int64(float64(ty + 1) * TileSize * res - OriginShift)
	return minX, maxY
}
originX, originY := TileBounds(tx, ty, zoom)
Now that we have the Origin’s coordinates in meters, let’s calculate the offsets dx and dy:
dx := mx - originX
dy := originY - my
Finally, let’s divide the offsets by the resolution, expressed in meters / pixel, to get the parameters for the instruction:
res := Resolution(zoom)
shiftX := uint32(math.Floor(float64(dx) / res))
shiftY := uint32(math.Floor(float64(dy) / res))
We now have everything we need to construct our feature:
geomType := Tile_POINT
feature := Tile_Feature{
    Type: &geomType,
    Geometry: []uint32{
        1 & 0x7 | 1 << 3, // Command 1 (moveTo), count of 1
        (shiftX << 1) ^ (shiftX >> 31),
        (shiftY << 1) ^ (shiftY >> 31),
    },
}
The geometry is a little odd, but here’s what’s happening:
- We pass in a slice of instructions, which is made up of a command followed by parameters
- To place a Point, we use the command
moveTo, to move the cursor - This command expects two parameters,
dXanddY, which we pass in usingzigzagencoding
We can go ahead and add this feature to our tile:
t.Layers[0].Features = append(t.Layers[0].Features, &feature)3. Add properties
We now have a tile that meets the basic requirements:
- 1 layer
- 1 feature in the layer with a valid geometry
I now want to add the properties defined in the GeoJSON, in this case, the name and the status for the Statue of Liberty.
As with GeoJSON, you can store properties for each feature. So here, the status could be one of three:
open: Open for visit.closed: Closed for visit.maintenance: Closed for maintenance.
Adding the status open to the Statue of Liberty in GeoJSON looks like this:
{
  "type": "Feature",
  "geometry": {
    "type": "Point",
    "coordinates": [-74.04452395542852, 40.68987850656795]
  },
  "properties": {
    "name": "Statue of Liberty",
    "status": "open"
  }
}
So, if I have 10’000 monuments, I’ll have 10,000 dictionaries like this:
"properties": {
    "name": "<Monument Name>",
    "status": "<Monument Status>"
  }
That means repeating open, closed or maintenance 10,000 times. Best case scenario, that’s 40,000 bytes (open 10,000 times),
and you probably want a unique name for your monument, so add another 10,000 strings to your file.
You can definitely improve this by shortening the status to something like o for open, and s for status, but this will only
get you so far as you scale (especially if you’re dealing with numbers, where these tricks won’t work) and add more properties and features.
Vector Tiles use a different approach: tags. In each layer, you define a set of keys and a set of values.
In our previous example, the keys would be [name, status] and the values would be [Statue of Liberty, open, closed, maintenance]:

So let’s add the known keys and values to our layer:
t.Layers[0].Keys = []string{"name", "status"}

SoLName := "Statue of Liberty"
StatusOpen := "open"
StatusClosed := "closed"
StatusMaintenance := "maintenance"
t.Layers[0].Values = []*Tile_Value{
    {StringValue: &SoLName},           // 0
    {StringValue: &StatusOpen},        // 1
    {StringValue: &StatusClosed},      // 2
    {StringValue: &StatusMaintenance}, // 3
}
Now that our layer knows what keys and values to expect, we can go ahead and set the property for the Statue of Liberty:
t.Layers[0].Features[0].Tags = []uint32{0, 0, 1, 1} // name: Statue of Liberty, status: openIf we wanted to update the status to inform users the Statue of Liberty is closed for maintenance, we would simply update the tags to:
t.Layers[0].Features[0].Tags = []uint32{0, 0, 1, 3} // name: Statue of Liberty, status: maintenance4. Return the tile via HTTP
Our tile t isready to be returned to the frontend via an HTTP GET request.
To convert our tile to the MVT binary, simply use:
import 	"github.com/gogo/protobuf/proto"

out, _ := proto.Marshal(t)
out contains the []byte data that represents the .mvt file. Be sure to set the following header in your HTTP response:
"Content-Type" : "application/vnd.mapbox-vector-tile"And there it is - a vector tile built entirely from scratch, using geographic information contained in a GeoJSON file. When you’re using a map, you’ll almost always be visualizing more than one tile at a time, and zooming in and out. This means each feature will be on multiple tiles, one per zoom level, so you’ll need to design a strategy to handle this. The below code is a quick snippet of the implementation used for the Dashboard (some of the HTTP code is using an internal library, it can easily be replaced with your own HTTP server implementation / library):
type TileMap struct {
	Tiles map[int]map[int]map[int]*Tile // [z][x][y]Tile
}

func NewTileMap() *TileMap {
	tiles := make(map[int]map[int]map[int]*Tile)
	for _, zoom := range Zooms {
		tiles[zoom] = make(map[int]map[int]*Tile)
	}
	return &TileMap{Tiles: tiles}
}

func (tm *TileMap) GetTile(z int, x int, y int) *Tile {
	if xyMap, zExists := tm.Tiles[z]; zExists {
		if yMap, xExists := xyMap[x]; xExists {
			if tile, yExists := yMap[y]; yExists {
				return tile
			}
		}
	}
	return nil
}
tm := NewTileMap()

// Generate the tiles here and populate the tile map using the above code
// ...

h.PublicHandler("GET", "/layer/potholes/{z}/{x}/{y}/tile.mvt", func(r *http.Request) web.HttpResp {
		z := r.PathValue("z")
		x := r.PathValue("x")
		y := r.PathValue("y")
		zInt, _ := strconv.Atoi(z)
		xInt, _ := strconv.Atoi(x)
		yInt, _ := strconv.Atoi(y)
		var out []byte
		if tm == nil {
			out, _ = proto.Marshal(mvt.NewTile("empty"))
		} else {
			tile := tm.GetTile(zInt, xInt, yInt)
			out, err = proto.Marshal(tile)
			if err != nil {
				// Generate an empty tile
				out, _ = proto.Marshal(mvt.NewTile("empty"))
			}
		}
		return web.HttpResp{
			Data:        out,
			StatusCode:  http.StatusOK,
			ContentType: "application/vnd.mapbox-vector-tile",
		}
	})
We’ve now created an HTTP server that returns MVT files on demand, as a user explores the map.
Did the performance improve?
After deploying the MVT tile server for my GeoJSON layers that contain points, this is what we get:
- File size decreased to 3.7Mb (I mean, we removed GeoJSON data, so no surprise there), meaning the site now loads in 500ms
- The paint time has decreased (by about 200ms, not bad for migrating just 2 datasets over), and the performance score went up by 8% according to Lighthouse:

I’m running this process off of a server in my office, and I use Cloudflare Tunnels to expose the site, which unfortunately means the tiles don’t return very fast. This means I’m going to have to move this over to AWS, something I’ve been meaning to do, and I expect the tiles to return a lot faster, hopefully sub 100ms.
I still have to move over the non-Point layers that are still GeoJSON, so I expect a big gain in performance there. More soon!
What’s next?
This simple example only focuses on Points. Implementing lines and polygons requires more work, as they can span multiple tiles. I’ll put out a new post once I’ve implemented these, along with performance metrics of the Dashboard.
I’m also looking forward to seeing MapLibre tiles ready for production use, so I can generate MapLibre tiles and get some additional performance gain and contribute to the MapLibre ecosystem.
I’m working on making the Go code open source in a small geographic library, which I’ll put on Hudson Shipping Co’s github.
Thank you!
Thank you for reading until the end! Feel free to reach out to me at [email protected] for comments or questions.